Kubernetes, the most popular container orchestration platform available today, helps you run and manage the life cycle of your containers with minimum human involvement.
Logging is one of the key aspects of running and managing workloads in production environments, enabling you to understand, observe, and debug system behavior. In this post, I will be discussing the nitty-gritty aspects of properly setting up and managing logs with Kubernetes.
Logging Architectures
There are many ways to manage logs in Kubernetes. Depending on the situation, you would have to use different logging architectures. In this section, I’ll be discussing different types of logging architectures that can be implemented with Kubernetes.
1. Kubectl Logs
Without any configurations, you can easily browse the logs of your containers running inside pods using the kubectl tool. To do this, run the following command:
Kubectl logs <pod-name> <container-name>
This is the simplest logging solution available with Kubernetes. You can even browse the logs of the previously run container if there were any restarts, by adding the –previous flag to the above command, as follows:
Kubectl logs <pod-name> <container-name> –previous
However, this is where the road ends for this logging mechanism. You won’t be able to browse the logs of a container that has already been restarted many times. You can only browse the last iteration of restarted container logs or query logs, as you see fit. If your deployments were updated with a new container image, you won’t be able to browse the logs of the previous pods. With Kubernetes, you can browse only the logs of currently running pods. As a result, Kubernetes administrators tend to set up a more permanent logging solution to address these limitations.
2. Node-Level Logging
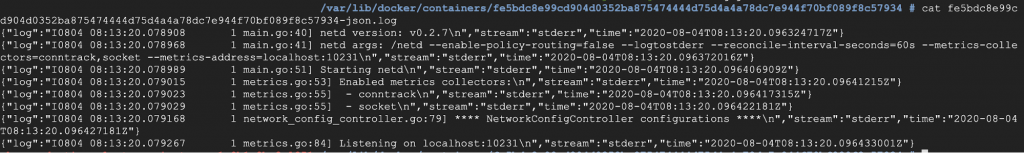
Again, without any configurations, you can browse your container logs by manually logging into your Kubernetes nodes and browsing through the /var/log folder. Kubernetes uses a container runtime engine like Docker/Containerd/CRI-O to run containers, and these engines save the logs in the host machine, ideally in the /var/log folder. (The log location could be different, depending on your container runtime engine configurations.) You can browse Docker logs through the following path:
/var/lib/docker/containers/<container–id>
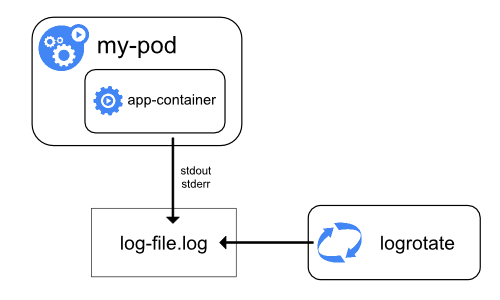
The diagram above simply showcases how container logs are stored at the node level. Logrotate rotates these logs according to the time interval you define.
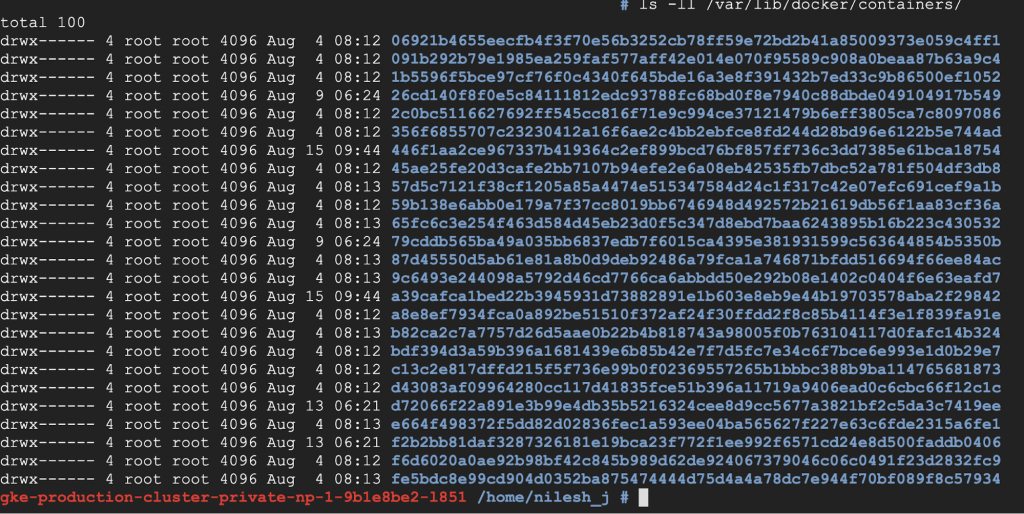
However, although the logs are persisted here, browsing logs through this method is not feasible, since you’d have to browse Kubernetes nodes and look at logs one by one. As you can see, the names of these files are just ID numbers generated by Kubernetes. That means that this isn’t a good solution either. This architecture, though, will lead you to a better solution in the next section.
3. Cluster-Level Logging
This is the de facto standard logging architecture on Kubernetes. Here, you’ll utilize the node-level logs, read them through, and stream them to a log sink, using a node-logging agent. In each node, there’s a logging agent running that streams the node logs to a log sink, which allows you to browse and run queries against the logs that were saved.

As figure 4 shows, the container writes to the log file, and a logging agent reads that log file and streams the log contents to a log sink. In Kubernetes, you have to run this logging agent as a DaemonSet, enabling you to run and manage our logging agent pod on each of the available nodes.
4. Sidecar Log Stream to Node Logs
By default, container stdout and stderr logs are the logs you collect in the logging architectures discussed above. However, this does not happen when your container is writing logs to a file inside the container. Since containers are stateless, your logs will be gone the moment you restart the containers, unless you use a persistent volume binding for those logs. But that, too, could pose a few issues if you scale your application and the compatibility of Read-Write-Multiple (RWX) Mode of the persistent volume you decided to use. (Most volumes don’t support RWX). Therefore, a better approach is to inject a sidecar agent to stream your in-container logs to “standard out,” as shown in the following diagram:
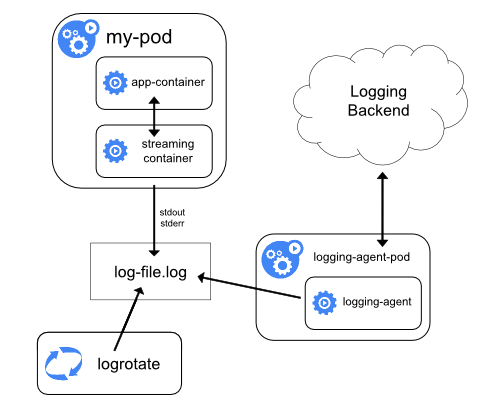
Figure 6 shows an example of the above implementation:

For the full code click here.
In this example, you have a simple pod with two containers. Container 1, named “date,” is a busybox that writes the current date to a file on /var/log/date.log every second. Container 2, named “date-log-stream,” reads the /var/log/date.log file and streams it to stdout using the tail command. The path /var/log/ in both containers is shared by an emptyDir Volume in Kubernetes called varlog.
Using this method, you can easily stream non-stdout, stderr container logs to stdout and stream them to your log sink using cluster-level logging architecture.
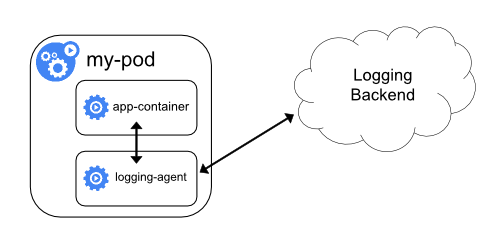
5. Sidecar Log Stream Direct to Log Sink
There are some scenarios where you’ll want to direct some of the logs in your containers straight to a log sink, without going through cluster-level logging. An example would be audit logs. Enterprises might have a policy of streaming cluster-level logs directly to a log sink like Elasticsearch, and maybe audit logs to a different, secure log sink. In such situations, you can run a log streaming agent directly as a sidecar to your container and stream logs directly to the specified sink, as shown in figure 7:
We know tech blogging
Logging Stacks
Now that you have learned about logging architectures, let’s discuss the tooling that allows you to implement them. There are three components associated with a logging stack:
Log Streaming Agent
A streaming agent is responsible for watching a given set of files, aggregate, and filter and stream them to a log sink. Below find the most popular log streaming agents available in Kubernetes.
Logstash is a project by Elasticsearch. It is part of the elastic stack and is capable of log aggregation, transformation and log based metric generation in a kubernetes cluster.
Fluentd and Fluentbit are 2 separate projects that are currently in the CNCF sandbox. Fluentbit is the lightweight version of fluentd and these 2 projects are capable of supporting log streaming to multiple log sinks. Both of these support log aggregation and transformation, but fluentd has better log support per development language/framework and has more plugins. Usually, fluentd is used for cluster level logging and fluent bit is used for sidecar log streaming as it is lightweight.
Promtail is one of the latest log streaming solutions built specifically for Kubernetes by the guys behind grafana and prometheus. Configuration is exactly the same as how you would configure prometheus and is built to work out of the box with Loki, a log sink written by the same team. Promtail supports log aggregation and transformation along with log relabeling.
Log Sinks
A log sink or a log store allows you to store, query and rotate your logs according to your requirements. There are a lot of popular log sinks available for Kuberentes, but in this post I will be talking about the most popular open source ones.
Elasticsearch is a NoSQL database that can be used as a log store in Kubernetes. It can store large chunks of log data, can be scaled, indexed and queried effectively. Elasticsearch indexes every field, resulting in large indexes that accumulate a lot of storage space. Elasticsearch can be run in High Availability mode and a single instance of Elasticsearch requires a minimum of 3GB of memory in order to run effectively in your Kubernetes cluster.
Written by the prometheus team specifically for handling logs in Kubernetes, Loki is a CNCF sandbox project which is horizontally scalable at petabyte scale. Loki is less resource consuming compared to Elasticsearch and stores smaller indexes by indexing only a handful of fields unlike Elasticsearch. This results in less storage space utilization and can be run on Kubernetes with less resource utilization. Loki has a log querying language called LogQL to query logs, similar to Prometheus metric query language, PromQL.
Log Browsers
A log management system is not complete without a proper UI to browse the logs. There are quite a lot of log browsing tools available for Kubernetes and here, I will be discussing the top open source solutions that support log browsing for the technologies discussed in previous sections.
Final piece of the elastic stack. Kibana has an intuitive UI that allows you to manage your Elasticsearch indexes, save and export log search results. Kibana provides a metric dashboard too that works with the rest of the elastic stack components and has RBAC and security integrated in the enterprise version.
Grafana is currently the most popular open source visualization dashboard available for metrics of any kind. Recently with the introduction of Loki, Grafana extended support for log querying with Loki. If you are using prometheus for monitoring and using Loki for logging, grafana can be a one stop hub for all your logging and monitoring visualizations and browsing.
Our Recommendation
The previous section summarized the most popular stacks for cluster-level logging solutions for Kubernetes. When you’re choosing a log sink, Elasticsearch is great, but there’s a bit of management overhead, along with massive resource consumption.
While Elasticsearch is built with big data in mind, it can have larger indexes when used as a log sink, which would double your storage capacity. Loki, on the other hand, consumes fewer resources and stores smaller indexes. Loki was built for storing logs and querying them, as opposed to Elasticsearch, which is a general big data solution.
Fluentd is a widely used log-streaming platform with support for multiple log sinks. It supports streaming to Elasticsearch, Loki, and many other open-source and paid log sinks, with minimum configuration. Promtail is specifically designed to stream logs to Loki, and Logstash takes a general approach, as well as supporting multiple log sinks. Fluent Bit, a lighter version of Fluentd, is mostly used to stream logs directly from a sidecar.
What’s the best log browser? That depends on your log sink. Kibana is the way to go if you’re using an Elasticsearch log sink, and Grafana would be best if you’re using Loki. Grafana, however, supports Elasticsearch and a few other log sinks as well, other than Loki, but its functionality may be limited.
Cluster-level logging is one of the primary items on the checklist of any Kubernetes administrator who needs observability. If your cluster is managed by a cloud vendor, this is already set up for you, connecting your logs to the log service provided by the cloud vendor. However, if you have to stream logs directly from the container, you’ll have to set up a log streamer.
Ideally, I would recommend FluentBit to stream logs to whatever log sink you have. For an on-premises cluster, Loki, Promtail, and Grafana is the ideal stack to choose, as this solution is light-weight and was specifically developed to manage Kubernetes logs. However, you might want to replace Promtail with Fluentd if you have multiple log sinks to stream.
