Have you faced performance issues with your Elasticsearch cluster during write-heavy workloads? Have you encountered limitations with your Elasticsearch indexing speed? Have you bumped into latency problems where your searches are taking too long to execute or faced challenges troubleshooting operational issues with your Elasticsearch cluster? Have you struggled to improve the stability of your Elasticsearch cluster during outage situations or ever wondered which metrics to look at from an Elasticsearch monitoring perspective?
If your answer to any of the above questions is “yes,” then this article is for you.
I’ll explain some of my experiences with troubleshooting and resolving Elasticsearch’s performance issues. By the end of this article, you should have a good understanding of the critical metrics to monitor when you bump into performance or operational problems with your Elasticsearch cluster. I’ll be citing examples and monitoring metrics from the Amazon Elasticsearch service, but the same metrics hold true if you’re hosting Elasticsearch on your own or using some other managed providers.
So, what are the top five Elasticsearch metrics to monitor?
Cluster Configuration
Elasticsearch is a distributed search engine that provides fast search performance and indexing speed. The out-of-the-box Elasticsearch configurations satisfy a lot of use cases. However, if you want to achieve optimal performance, it’s critical to understand your indexing/search requirements and ensure that the cluster configuration aligns with Elasticsearch best practices.
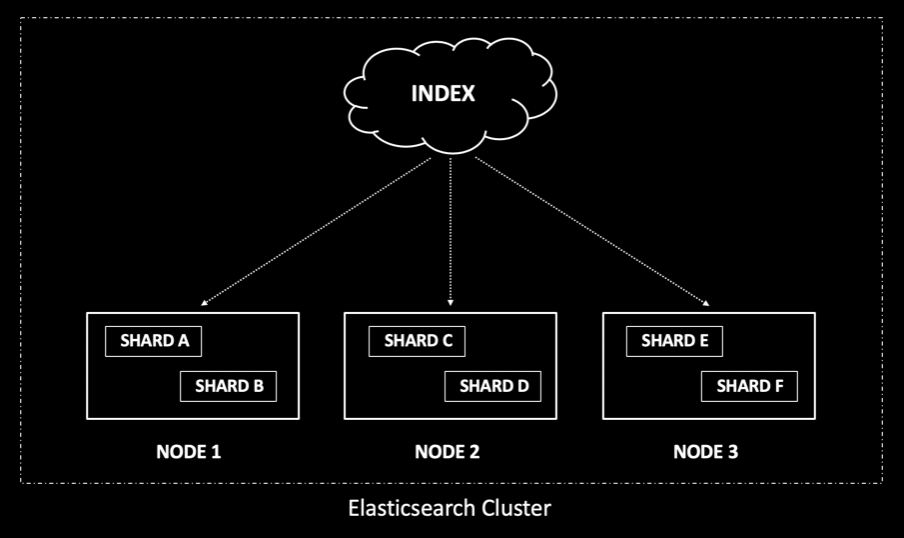
Elasticsearch is built to scale, and having an optimal configuration ensures better cluster performance. Inside the cluster, you have various elements. The node can be viewed as a machine running the Elasticsearch process. An index can be considered a complete search engine on its own, consisting of one or more shards. A shard can be visualized as a single instance of Apache Lucene that holds the documents used for indexing and searching, with the documents distributed evenly between shards.
Figure 1: A three-node cluster with the index divided into six shards
Shards can increase the ingest and search performance, but having too many shards can also slow things down. Having a proper sharding strategy is critical for the cluster. The recommendation is to have a shard size that’s between 30-50 GB. Having the shard count higher than the node count allows you to scale your cluster, although the overallocation of the shard might slow down your search operation since a search request needs to hit every shard in the index and then perform an aggregation. If you have a shard that holds 5 GB of data, it can be considered as underutilized.
Do you have experience with Elasticsearch? We’re seeking tech bloggers to write more articles like these. Learn more.
An easy way to check your overall cluster configuration is by using the cluster health API:
GET /_cluster/health?pretty
{
"cluster_name" : "elastic-customer",
"status" : "green",
"timed_out" : false,
"number_of_nodes" : 7,
"number_of_data_nodes" : 4,
"discovered_master" : true,
"active_primary_shards" : 7,
"active_shards" : 14,
"relocating_shards" : 0,
"initializing_shards" : 0,
"unassigned_shards" : 0,
"delayed_unassigned_shards" : 0,
"number_of_pending_tasks" : 0,
"number_of_in_flight_fetch" : 0,
"task_max_waiting_in_queue_millis" : 0,
"active_shards_percent_as_number" : 100.0
}
Developers often wonder what the optimal number of shards that need to be configured is and how to ensure they are neither underallocating nor overallocating the cluster. I would say there is no one-size-fits-all solution to these questions; it depends upon your business requirement and the SLAs you’re trying to meet.
Several stats will help you make the correct capacity planning decision: the number of documents per second you need to index, size of the document, number of queries per second you need to search, and growth pattern for your dataset. Doing a benchmark performance test with a small subset of data can help you make the correct decision.
I would highly recommend you understand your data and indexing/searching requirements to create a balanced and performant cluster.
Total Free Storage Space
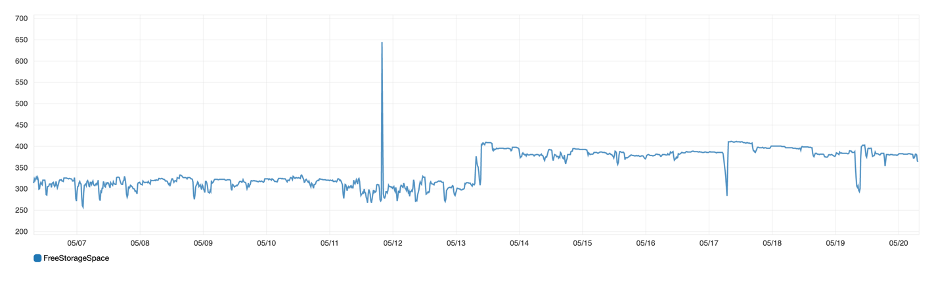
If your Elasticsearch is running low on disk space, it will impact the cluster performance. Once the free storage space goes below a particular threshold limit, it will start blocking incoming write operations into the cluster. Hence, it’s critical to monitor your cluster for low free storage space.
Figure 2: Total amount of free storage space across all data nodes
Deleted Documents
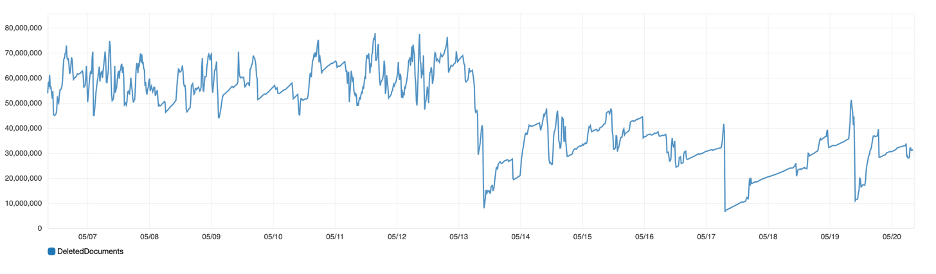
Documents in Elasticsearch cannot be modified and are immutable. Deleting or updating a document marks it as deleted and does not remove it immediately from Elasticsearch. These documents will get cleaned up in the background as you continue to index more data. The deleted documents are not involved during search operations, but they continue to occupy disk space.
Figure 3: Total number of deleted documents across all indices in the cluster
If disk space becomes an issue, you can run the force merge operation. This will merge the segments and clean up the deleted documents. If you reindex your documents into a new index and remove the old one, you can get rid of the deleted documents. You’ll have a high deleted document count if you have an index that is regularly getting updated. So it’s best if you had a strategy in place to clean up deleted documents when disk space becomes an issue.
Master Node Metrics
In a production environment, it’s suggested that you configure dedicated master nodes in your Elasticsearch cluster. The master nodes increase the cluster’s stability by taking care of the cluster management activities like tracking all nodes, indices, and shards in the cluster. The master nodes also monitor cluster health, ensuring that the data nodes are not overloaded and making the cluster fault-tolerant. Another recommendation is to have a minimum of three master nodes. This ensures that the necessary quorum is in place to select a new master instance in the cluster during failure events.
You can finalize the size of the master node instances by reviewing the CPU/memory utilization and JVM memory pressure percentage for the master nodes. However, since master nodes focus on the cluster state, it generally requires machines with low CPU/memory resources.
Data Node Metrics
Data nodes host the shards that contain the indexed documents in the Elasticsearch cluster. They also perform all the data operations related to search and aggregation as well as process client requests. Compared to master nodes, the data nodes require machines with high CPU/memory resources.
Tech marketing professional? Content marketing manager? IOD supports your efforts by creating high-quality content for your tech brand. Learn how you can hire this expert to write articles for your tech brand blog.
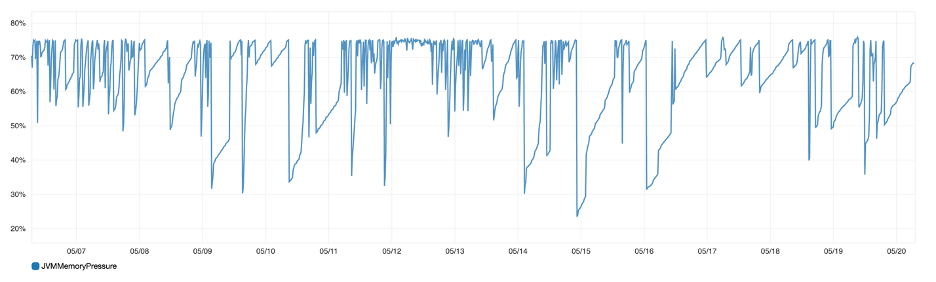
Figure 4: Maximum JVM memory pressure percentage for all data nodes
If your cluster does not have a dedicated master node, then one of the data nodes will start acting as the master. This creates unbalanced CPU and JVM usage in the cluster. The document CRUD and search operations are CPU and IO-intensive, hence monitoring the node utilization metrics is important. You should ensure that your data nodes are balanced and are not overloaded from a CPU/memory perspective.
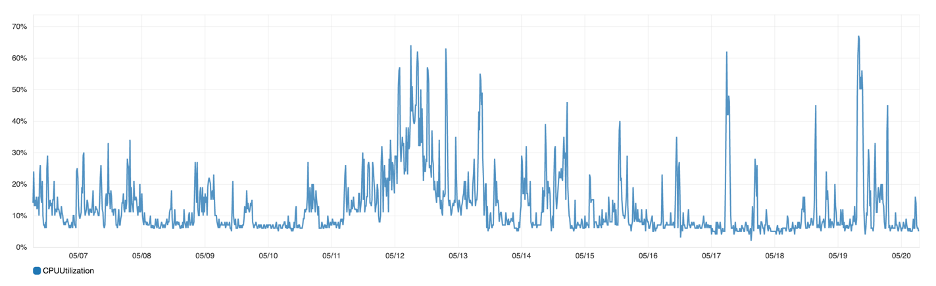
Figure 5: Maximum CPU utilization for all data nodes
Indexing Performance
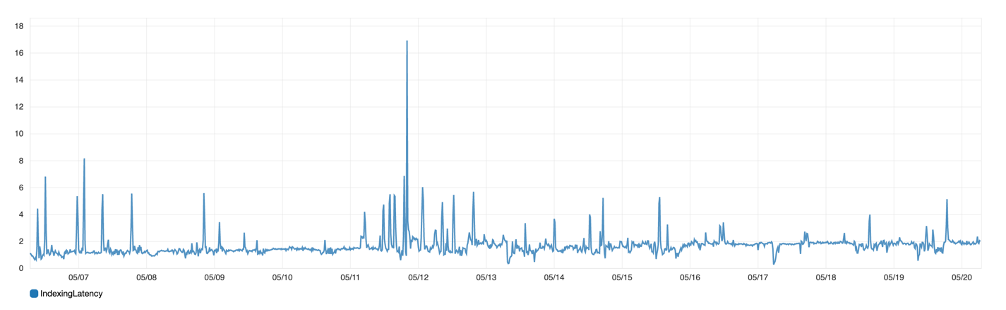
If you’re trying to index a large number of documents into Elasticsearch, you can monitor the indexing latency and indexing rate metrics to verify whether the indexing throughput meets your business’ service-level agreements.
Figure 6: Indexing latency: Average time that it takes a shard to complete an indexing operation
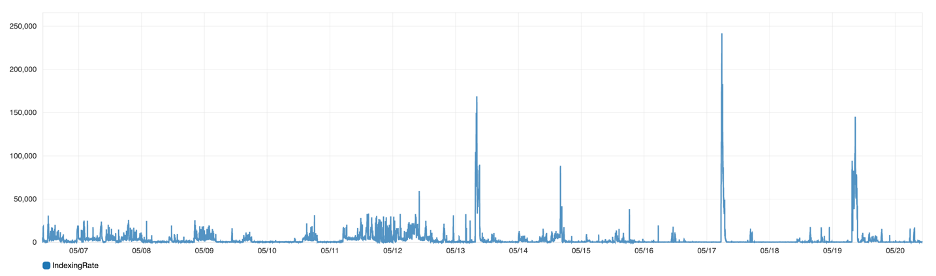
Figure 7: Indexing rate: Number of indexing operations per minute in the cluster
You can leverage the bulk API provided by Elasticsearch to index a batch of documents at the same time. You can also have multiple threads writing to Elasticsearch to utilize all cluster resources. Note that the document size and the cluster configuration can impact the indexing speed. To find the optimal throughput for your cluster, you will need to run performance tests and experiment with different batch sizes and concurrent threads.
Elasticsearch refresh is the process of making the documents searchable. By default, every shard is refreshed once every second. If the primary objective is to tune the index for ingest speed, you can modify the default refresh interval of Elasticsearch from 1 second to say 30 seconds. This will make the document visible for search purposes after 30 seconds, hence optimizing the indexing speed. This can be a good use case during heavy-index scenarios or when indexing speed is more critical than search performance.
Replicas provide additional capability for reads and searches but have an associated cost. During the initial data load, you can disable replicas to achieve high indexing speed, which means you will be giving up high availability and protection against data loss in disaster scenarios. Once the initial load is completed, however, you can re-enable the replicas.
Don’t index fields that are not searchable. You can also save storage space by not indexing redundant fields. Hence, I strongly suggest updating the mapping of your cluster to disable features that are not leveraged for search purposes.
Search Performance
A search request in Elasticsearch is sent to all the shards in an index. The node that receives the request then aggregates the results from all the shards and returns the result to the calling application. Shards consume CPU/memory resources. So if you have too many shards, it might
slow down your query performance. If the number of updates to the cluster is high, it might affect the search SLAs. By adequately configuring and horizontally scaling the cluster, you can decouple your indexing and search performance.
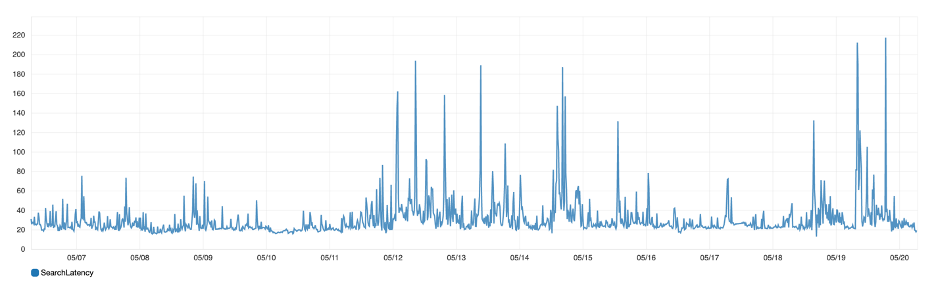
From my experience with tuning search performance, I would highly recommend you limit the number of documents you return from your search query by adding appropriate filters. This will speed up your query performance since the score is calculated for only a limited set of documents after the filter is applied. You should also monitor the search latency and search rate metrics to investigate performance issues related to search functionality.
Figure 8: Search latency: Average time that it takes a shard to complete a search operation
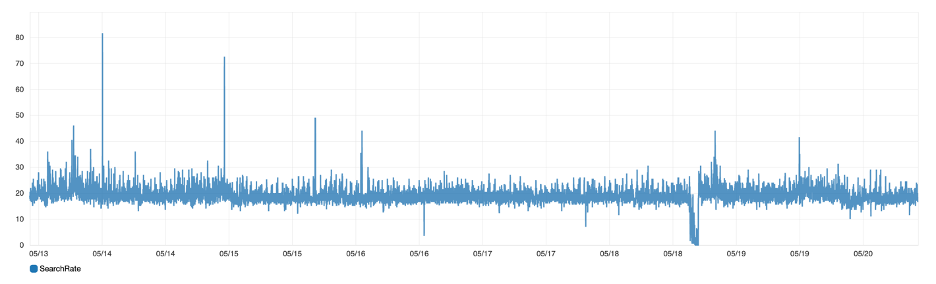
Figure 9: Search rate: Number of search operations for all shards in the cluster
I would also suggest you enable slow query logs in your Elasticsearch cluster to troubleshoot performance issues and capture queries that take longer to run or violate the set threshold.
For example, if you have a search SLA of 2 seconds, you can configure the search query as below, and any query exceeding the threshold will be logged.
index.search.slowlog.threshold.query.warn: 2s
Conclusion
In this article, I covered some of the most critical Elasticsearch metrics to monitor and discussed measures to optimize performance from both search and indexing perspectives. To summarize, here are the key takeaways:
Have dedicated master and data nodes in the cluster to ensure optimal cluster performance.
Scale your workload by adding more data nodes in your cluster and increasing the number of replica shards.
A search query has to hit every shard, so having too many shards can make your searches slower.
Use the slow query and index logs to troubleshoot search and index performance issues.
Ensure that your Elasticsearch cluster is right-sized in terms of the number of shards, data nodes, and master nodes.
Tune Elasticsearch indexing performance by leveraging bulk requests, using multithreaded writes, and horizontally scaling out the cluster.
Samir
IOD Expert
Samir is a system architect who builds software solutions using cutting edge technologies. He is a Microsoft MVP with more than 14 years of IT experience working on large-scale enterprise applications.