Serverless technology has made it possible to deploy code without knowing anything about the underlying server infrastructure. As a result, running code in the cloud has never been easier.
AWS Lambda was the first function-as-a-service (FaaS) offering, and it is an attractive option for running workloads in the cloud. This is not only because of the hassle-free deployment, but also because of the advantages it brings in terms of scalability and pricing.
Although managing servers is not a concern with AWS Lambda, functions still need to be monitored like any other code to ensure that they continue to operate in a stable manner and to keep costs under control. Logs and metrics from AWS Lambda functions are collected in CloudWatch, but it can be tedious to locate the right information.
The ELK stack, on the other hand, is well-known for how it can be used to quickly and easily perform analytics on vast amounts of data. It’s also useful for centralizing log data from various sources, so you can get a unified view of all your digital resources whether they’re in the cloud or not.
In this article, I’ll show you how you can use ELK to get the best insights about your AWS Lambda functions.
Setting Up a Lambda for Structured Logging
As an example, let’s imagine I want to write a JavaScript function that computes the factorial of an integer using JavaScript. There are many ways this could be written, but I’ll use this simple implementation:
const factorial = n => n <= 1 ? 1 : factorial(n - 1) * n;
I can write a Lambda function that uses this logic, targeting the Node.js runtime. Aside from the necessary boilerplate (a function that acts as an entrypoint and gives us an input event object), I will also be logging a JSON object to the console:
exports.handler = async (event) => {
const result = factorial(event.n);
console.log({
n: event.n,
factorial: result
});
return result;
};
Are you a tech blogger?
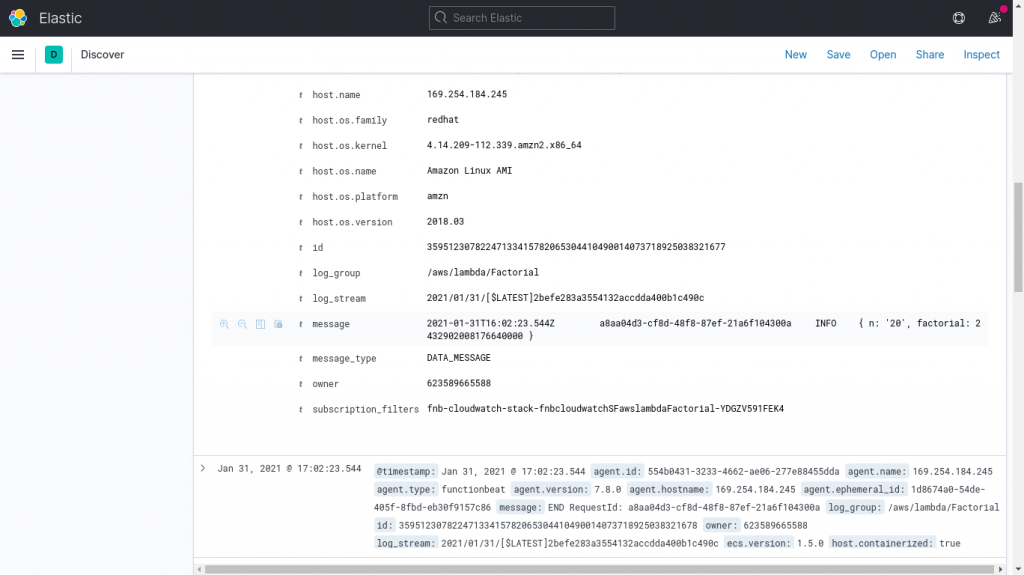
The JSON structure is important because it allows properties of the object to be parsed out as separate fields in Elasticsearch, which I can then filter separately.
Also, anything you write to standard output (in this case using console.log()) is automatically sent to CloudWatch.
All that’s left to do is deploy the function. While the easiest way to do this is to add the code via the AWS Console, I could also use CloudFormation or other tools for more advanced scenarios.
Once the function is deployed, I can test it directly from the AWS Console. Upon each execution, three types of monitoring data are sent to CloudWatch:
- Application logs: These are logs written to the console by the application code, such as the JSON object in the above example.
- Invocation logs: These are added by the runtime and provide information about that particular execution of the function, such as the billed duration.
- Metrics: These are statistics about all invocations of that function within a certain period of time.

There are a number of different metrics I could watch to know how my Lambda functions are faring, but the following are some of the more important ones:
- Invocations: This is the number of times the function was executed within a period of time. It gives me an idea of how much demand there is on the system.
- Errors: This is the number of times the function failed during that period of time. Anytime this is not zero, I’d like to know why and take remedial action if necessary.
- Duration: This tells me how long executions take to run on average. Since duration directly affects my billing, I want to ensure that it doesn’t spiral out of control.
- Concurrent executions: This shows how many instances of the function are running at the same time. This is important to watch because concurrency limits are imposed on AWS Lambda.
- Throttles: These are instances of the function that could not be executed because the concurrency limits have been exceeded. This can happen for a number of reasons and it’s important to investigate the cause.
Amazon Elasticsearch Service or Self-Hosted ELK?
AWS has its own managed Elasticsearch Service that I can use to quickly stand up an Elasticsearch cluster that also includes Kibana. As a managed service, it’s mostly hassle-free.
However, being a managed service also means that I have less control over it. For instance:
- At the time of writing this article, the latest Elasticsearch version I can use with the Amazon Elasticsearch Service is 7.9, even though version 7.10 has already been out in the wild for a couple of months.
- I can’t set up additional components in the cluster, such as Logstash.
- There are several feature gaps between the Amazon Elasticsearch Service and Elasticsearch proper. Furthermore, due to AWS recently forking Elasticsearch, any features from version 7.11 onwards will not be available on Amazon Elasticsearch Service.
Therefore, although Amazon Elasticsearch Service might be easier to set up and maintain, I might opt to run my own Elasticsearch cluster if I need any capabilities that are not available in the managed service.
Getting Lambda Logs into Elasticsearch
Many different applications benefit from centralized logging, whether they are Windows services or web applications. However, AWS Lambda does not provide an accessible filesystem, and this rules out certain simple and mature options for shipping logs to Elasticsearch, such as Filebeat.
In this section, I’ll discuss a few different options for getting AWS Lambda logs into Elasticsearch.
Sending Logs Directly
One option is for the Lambda function to interface directly with Elasticsearch and write logs into it from code (e.g., using a logging library that has an Elasticsearch target).
This approach is not ideal for various reasons, including:
- It puts additional processing and memory burden on the Lambda function itself, which can impact not only performance but also cost.
- If the code crashes before logs are written to Elasticsearch, they may be lost. This is especially risky when logs are buffered in memory.
- The AWS Lambda requires direct networking access to the Elasticsearch cluster storing the logs.
- It can ship application logs, but not invocation logs.
Normally, when writing logs from applications running on a virtual machine, I prefer to write logs to disk and use Filebeat to ship them separately. This approach is reliable, efficient, and does not impact the application at all.
With AWS Lambda, we don’t have a filesystem but we do have logs getting written to CloudWatch. We can leverage that to stream logs between CloudWatch and Elasticsearch—similarly to how Filebeat would send them from the filesystem to Elasticsearch.
Using a Streaming Subscription
CloudWatch logs support streaming subscriptions, meaning that you execute a (Lambda) function when new logs are received. This approach can be used to send new logs to Amazon Elasticsearch Service or execute arbitrary logic (e.g., trigger alerts).
While this normally works well, it is important to note that the approach doesn’t work exactly like Filebeat.
Since the shipping Lambda is triggered when new logs are available in CloudWatch, any failure in this Lambda (e.g., due to concurrency limits) means that logs will be skipped and won’t be available in Elasticsearch. Filebeat, on the other hand, will keep retrying until errors are resolved.
The streaming subscription can also be a little tricky to set up due to the permissions necessary to get it working.
Wouldn’t it be nice if all this could be set up for me? On that note, let’s take a look at Functionbeat.
Using Functionbeat
Like Filebeat, Functionbeat is one of Elastic’s many “beats,” or lightweight data shippers. However, due to the nature of serverless functions, it is quite different from the usual beats that run in the background and gradually ship logs and other data to Elasticsearch.
Instead, Functionbeat uses the same streaming subscription approach described earlier. However, it sets everything up for me using a CloudFormation stack, and can be used to send data to any self-hosted Elasticsearch cluster. Due to licensing restrictions, Functionbeat can’t be used with the Amazon Elasticsearch Service.
Getting Lambda Metrics into Elasticsearch
The different approaches discussed so far can only get logs into Elasticsearch. For metrics, I need to use Metricbeat.
Like most other beats, Metricbeat is deployed as a service (e.g., on an EC2 instance), and synchronises data between its data source (in this case CloudWatch metrics) and Elasticsearch. I can use the AWS module for Metricbeat to ship metrics from AWS Lambda and many other AWS services.
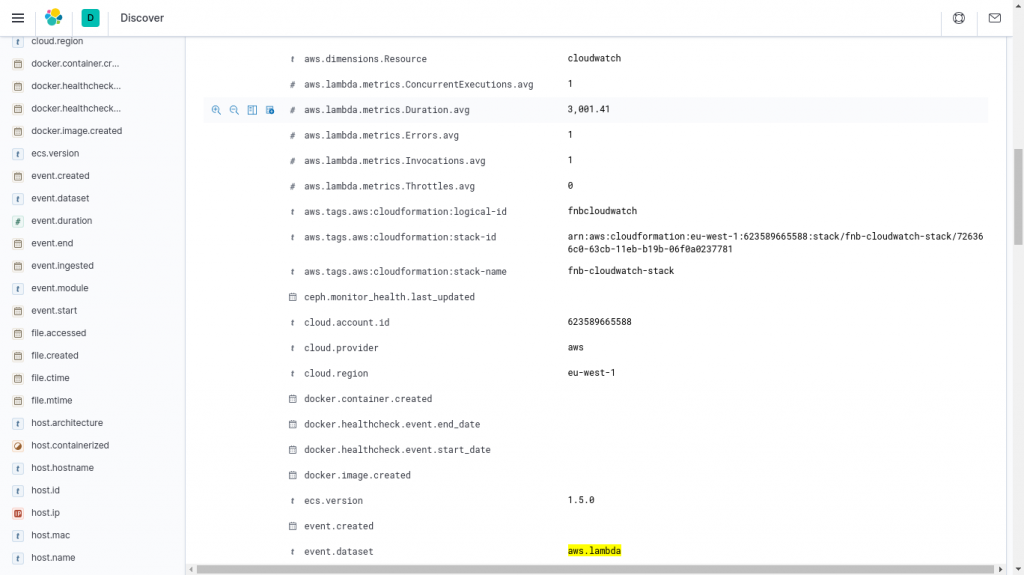
To view AWS Lambda metrics in Kibana, I first make sure I’m viewing the “metricbeat-*” index pattern, then use the filter event.dataset: aws.lambda. Metrics such as the average duration are among the fields starting with “aws.lambda.metrics,” as shown in the screenshot above.
Wrapping Up
As you can see, this leaves me with a lot of options for monitoring my AWS Lambda functions. Simply by writing application logs in JSON format to standard output, I can get those logs into CloudWatch in a format that is easy to later parse into individual fields. Invocation logs as well as metrics are automatically sent to CloudWatch by the AWS Lambda runtime.
I can choose to use the managed Amazon Elasticsearch Service or a self-hosted ELK stack to ingest and analyse logs. This is ultimately a tradeoff between administration effort and flexibility. Depending on which I choose, I can use either a streaming subscription or Functionbeat, respectively, to get application and invocation logs from CloudWatch into Elasticsearch. Either way, Metricbeat is the tool of choice for shipping metrics.
