“Cloud should be designed for security.”
“It should be designed for high availability.”
In cloud adoption-related conversations, these are recommendations we frequently hear. Well, here’s another nugget of wisdom that shouldn’t be ignored: Cloud should be designed for continuous monitoring.
If not monitored and analyzed, you probably wouldn’t realize that the weekly periodic CPU and memory spike in your e-commerce retail application is not a random occurrence you can keep snoozing away. It’s a cry for help that should be addressed with a scale-up or scale-out of the underlying infrastructure during peak shopping hours.
When it comes to digital transformation, Azure is undoubtedly one of the top public cloud platforms of choice for enterprises.
Azure delivers mature native monitoring tools as well as a vast portfolio of easily integrated third-party tools and services. In addition, the tools don’t just cover native Azure services, but can be extended to monitor resources in hybrid and multicloud environments as well—it’s just a matter of selecting the right strategy and tool for each use case.
In this blog, we’ll help you get started with monitoring in Azure by covering the fundamentals. What should be monitored? Which different tools are available? And how should hybrid and multi-cloud deployments be handled?
Key Constructs of Monitoring in Azure
Planning for your cloud monitoring framework is an important aspect of cloud adoption. Let’s explore the key considerations when planning to monitor workloads in Azure.
Logs and Metrics
The data used by any monitoring system can be broadly classified into two categories: logs and metrics. Logs consist of data collected over time from various sources—be it information about events on your Windows and Linux machines or network devices, or application-specific information found in your IIS logs. Logs provide a realistic snapshot of the activities taking place in your cloud resources, often marked by the time, duration, and frequency of the occurrence.
Metrics, on the other hand, are point-in-time signals collected from the resources. They provide information like CPU/memory/disk utilization, IOPS, service status, etc. Logs and metrics complement each other, and both should be included in your Azure cloud monitoring strategy.
Minimize the Noise
The main challenge faced by organizations when it comes to monitoring is isolating the data from the noise. There will always be information coming from multiple sources to your Azure monitoring tools, so how do you know what information is useful and what to ignore? The answer is: Plan for storage and data analytics to derive intelligence. The Log Analytics service can help you achieve this through a “plug and play” approach.
Visualization
Cloud deployments are often a maze of interconnected components, so when things go south, it’s difficult to pinpoint the issue. Monitoring tools with dependency mapping and visualization capabilities can help with this. A single-pane view guides mitigation efforts, pointing the operations team in the right direction and saving precious time, as they don’t have to hop around multiple tools.
Customers can also build their own dashboards using the Azure Dashboard service by pinning the relevant metrics and query results. You can even build comprehensive visualizations by importing log analytics data to PowerBI.
Alerts
Configuring alerts and implementing the right triage processes should go hand-in-hand so that incidents are investigated as soon as they’re reported. Azure Alerts allows you to use the common channels such as email, SMS, push, and voice notifications. It also integrates with ITSM tools such as ServiceNow and System Center Service Manager for streamlined triaging.
Auto-Remediation
In an ideal scenario, all alerts should first be handled by an auto-remediation mechanism before flooding your cloud operations team with alerts. With Azure monitoring, these capabilities are built in, which helps you execute scripts through Webhooks, Automation Runbooks, Azure Functions, Logic Apps, and more.
Are you a tech blogger?
Monitoring Tools in Azure
Let’s start with some of the native monitoring tools and services and how to best utilize them in some of the common monitoring scenarios in Azure.
As is commonly seen with cloud adoptions that have not been properly planned, customers will opt for an “as-is” match for VM SKUs or there’s an overprovisioning of resources when deploying/migrating workloads to Azure. This results in recurring performance issues or idle resources. Performance monitoring is, therefore, essential for VMs in Azure in order to detect such anomalies before they get out of control.
You can also take advantage of built-in metrics such as CPU usage, disk read operations/sec, disk bytes, network usage, and more to avoid the same issues. Additionally, the guest OS diagnostic data can be collected using a diagnostics extension, which collects more extensive performance metrics.
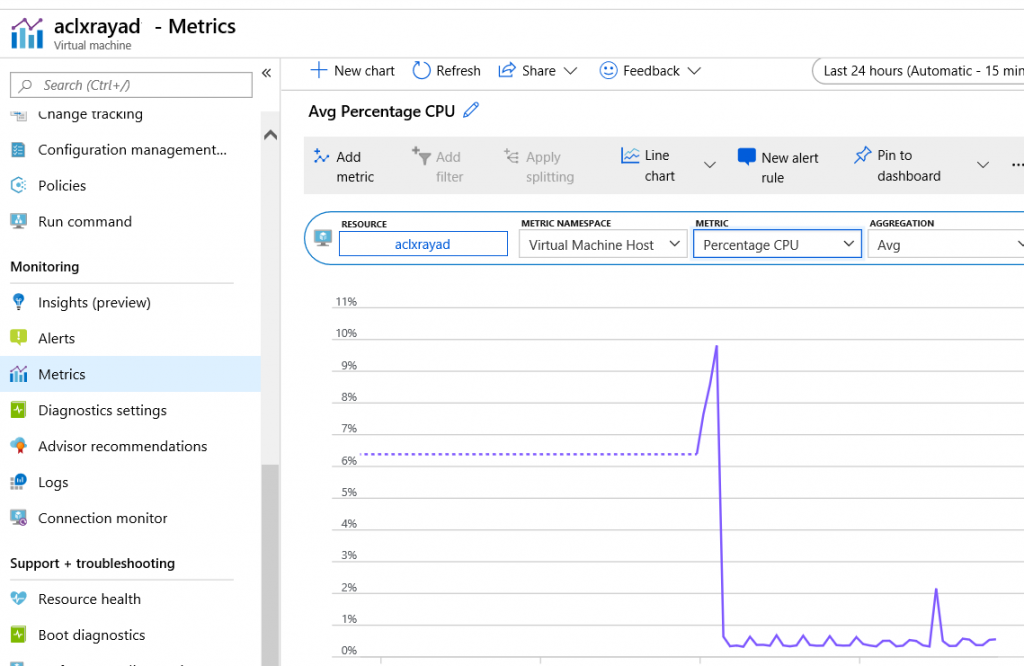
Metrics monitoring is straightforward, and data for the VM can be directly accessed from the Azure portal by choosing: VM-> Monitoring-> Metrics and then selecting the desired metrics from the drop-down menu, such as Percentage CPU. It’s also possible to set up an alert from the same menu, which will send an email to the respective application owner and to the operations team if the CPU utilization exceeds a specific predetermined threshold of say, 70%.
Multi-tier applications have different interlinked components, such as front-end/middle-tier services, NSG rules to control traffic, back-end databases, and application gateways. So when users complain about failed transactions, where do you check this? How do you know if there’s a network bottleneck or a VM utilization issue or whether one of the middleware services is down? In such cases, individual metrics are not much use, as you need an overview of all the moving parts, including traffic flow, to pinpoint the issue.
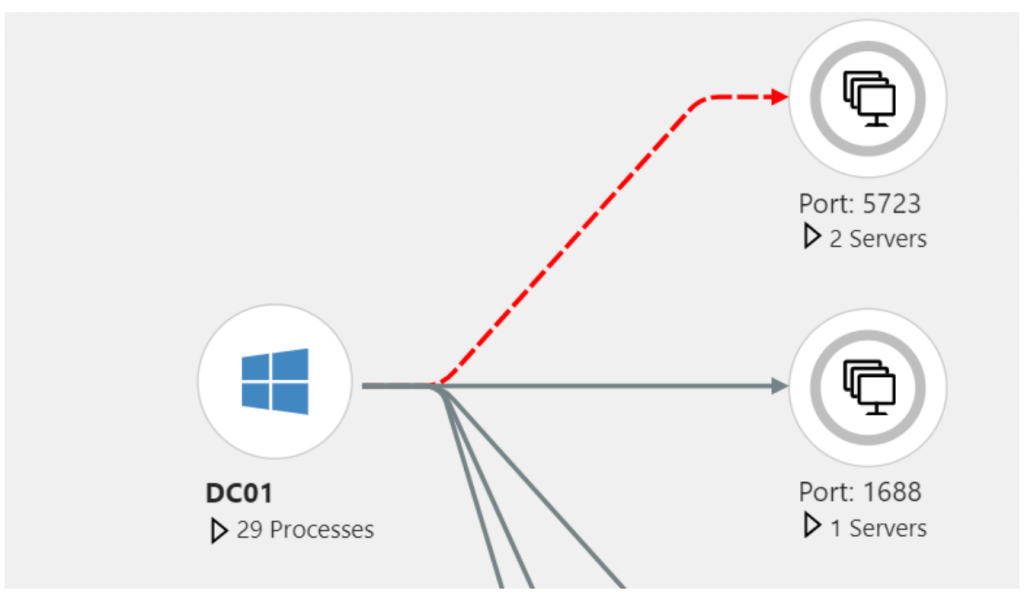
Azure Monitor’s dependency map feature will identify connected application components and provide a map view of how they interact with each other. It will also reveal the outbound/inbound communications and any apparent irregularities. As shown in the example below, a failed TCP connection attempt could indicate that an expected service is down in the target server or even that the wrong port is being used due to a misconfiguration.
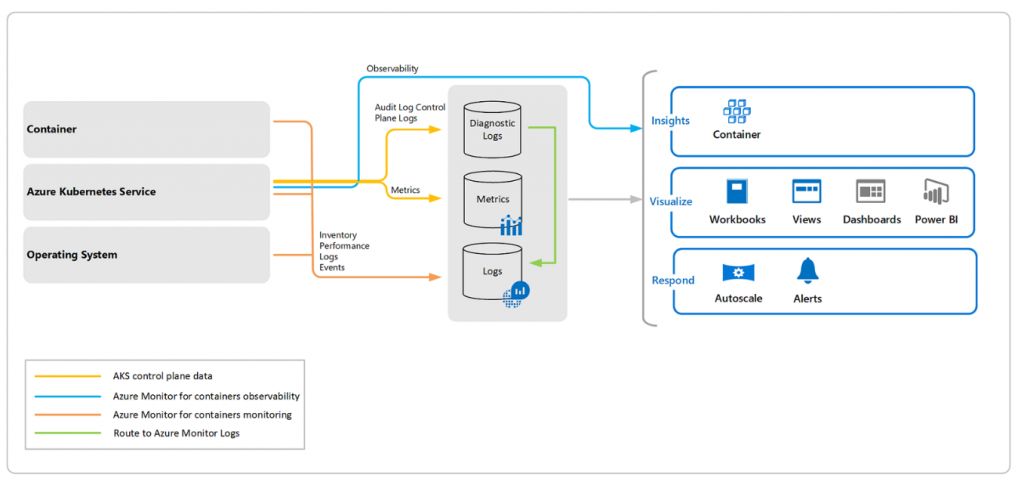
Increasingly, organizations are adopting microservice deployment patterns in Azure, using solutions such as Azure Kubernetes Service (AKS), Azure Stack, Azure Red Hat OpenShift, Azure Container Instances (ACI), and self-managed Kubernetes. Azure Monitor for containers provides comprehensive insights into the health of your container hosting platform as well as the performance metrics of workloads deployed on containers.
The service uses a containerized version of the Log Analytics agent to collect the relevant logs and metrics. This means that if any microservice hosted in an AKS cluster is found to be crashing during QA testing, the development team doesn’t have to search through the metrics of the AKS nodes and logs of each pod to find the root cause. Azure Monitor for containers also provides a unified console to view the health status and to search the container logs for possible anomalies.
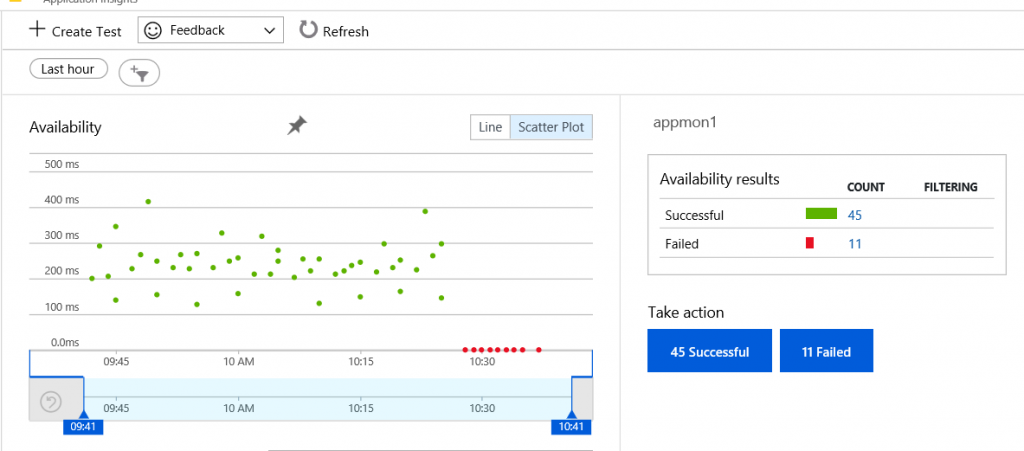
Application Insights is the one-stop solution for all your application monitoring needs, offering key application metrics such as request/dependency rates, response times, availability, exceptions, user session counts, and page views. For example, consider a scenario where you need to flag a specific application availability or performance issue, such as a user being unable to download data, a script not working, or an image not loading. You could set up availability tests with Application Insights to detect such an issue.
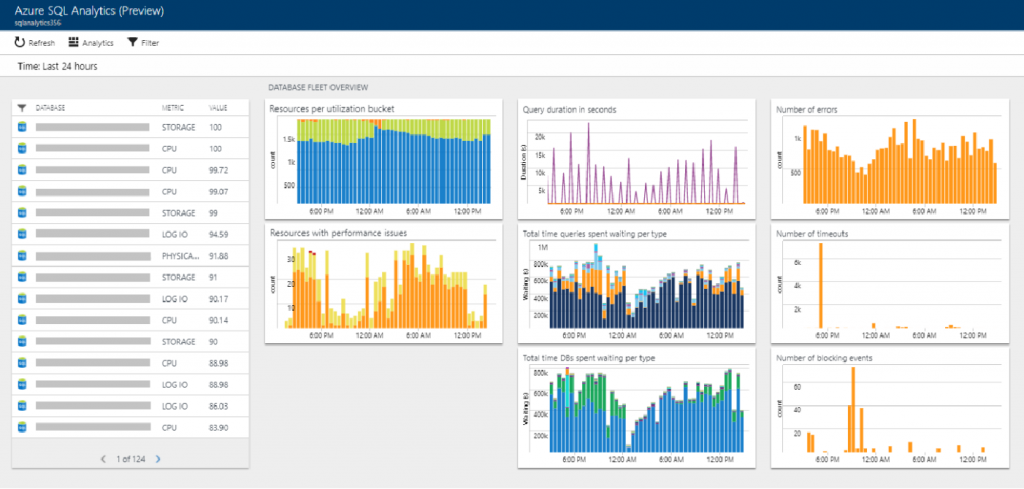
For PaaS services, such as Azure SQL Database, MySQL, and Azure Storage, basic metrics can be viewed directly from the Azure portal. Azure SQL is the most popular database platform in Azure, and the Azure SQL Analytics solution can be leveraged to stream database diagnostics telemetry. The solution’s dashboard view highlights performance issues, query information, database wait time, timeouts, errors, and more.
Last but not least, you’ll want to include Azure Security Center in your roster of tools, as it delivers unified security monitoring for hybrid deployments. Most of us in the cloud management business have dealt with shadow IT, and Security Center is the tool we’ve all been waiting for. It makes it easy to keep watch over the security of your Azure subscriptions, so you won’t be losing sleep over who might have deployed a potential goldmine for hackers in your subscription.
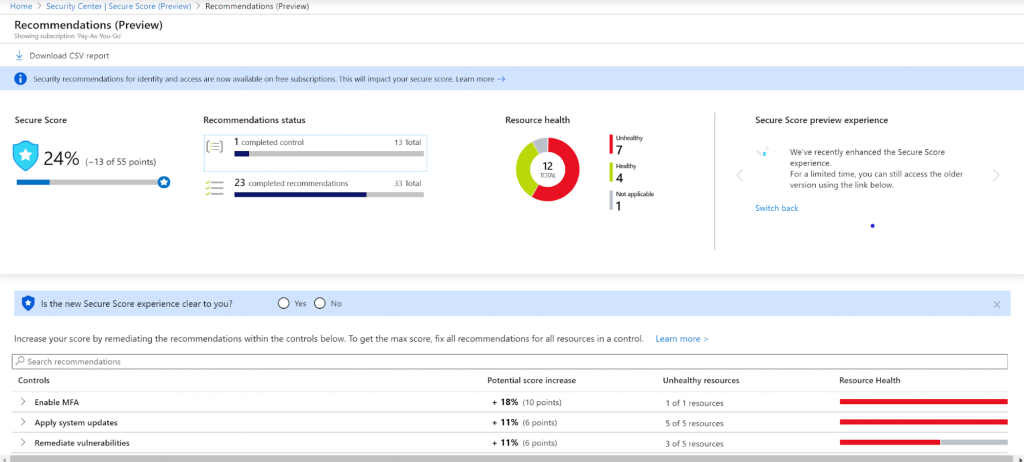
The majority of Azure services, such as Azure SQL Database, Storage, Service Fabric, and VMs are automatically onboarded to the Azure Security Center and monitored for best practice adherence and possible security loopholes through a continuous assessment approach. On-premises machines can also be onboarded to the Security Center by deploying a Log Analytics agent. Finally, a security score is assigned to your subscription by evaluating the resources against multiple security controls, which then provides a tangible indicator of your security posture along with actionable recommendations.
Hybrid and Multicloud
“Having multiple tools for cloud and on-premises monitoring has made my life so much easier,” said no IT operations person ever! Hybrid and multicloud deployments are the norm, and tool sprawl is a reality. Though cloud comes with its own set of tools and services, that doesn’t mean your existing trusted set of monitoring tools can be discarded overnight. The smart way forward is to strike a balance and integrate the environments into a single monitoring tool as much as is possible.
Azure native tools such as Log Analytics and Security Center offer extensive integration with on-premises and multicloud deployment components whereby you can stream your device and machine logs and connect resources or onboard machines. Azure also provides integration points to send logs and monitoring data from Azure resources to existing SIEM tools like Splunk, QRadar, SCOM, ArcSight, and others. The configuration involves streaming the data from Azure to storage accounts or an Event Hub, which is then consumed by your trusted SIEM tools. A SIEM-specific connector, such as Azure Add-on for Splunk, should be used to support this process.
Monitoring and DevOps
For full stack visibility and management, continuous monitoring of your DevOps practices along with IaC and CI/CD are a must. You should integrate your release pipelines with Azure monitoring and application insights early on in the software development lifecycle to achieve this. Then, use the data collected in your decision-making process for more robust and secure cloud deployments.
For instructions on how to do this, Azure Monitor’s tutorial on how to “add continuous monitoring to your release pipeline” is a good place to start, as it can be used for integrating application insights into your app service deployments. Using pre- and post-deployment gates that can query Azure Monitor alerts to detect anomalies is also recommended.
Final Word
As a passionate advocate of Azure cloud, I cannot emphasize enough the importance of monitoring. The fact that I have actually co-authored a book on monitoring in Azure should be proof enough!
For a more in-depth look into this topic, check out Understanding Azure Monitoring: Includes IaaS and PaaS Scenarios, which incorporates scenario-based examples, use cases, and implementation guidelines. Or, come back to the IOD blog where I offer many tips about Azure and for Azure users. Happy reading!